
Support and Resistance for Beginners: Simple Trading Guide
If you are learning technical analysis, understanding support and resistance for beginners is one of the best places to start.
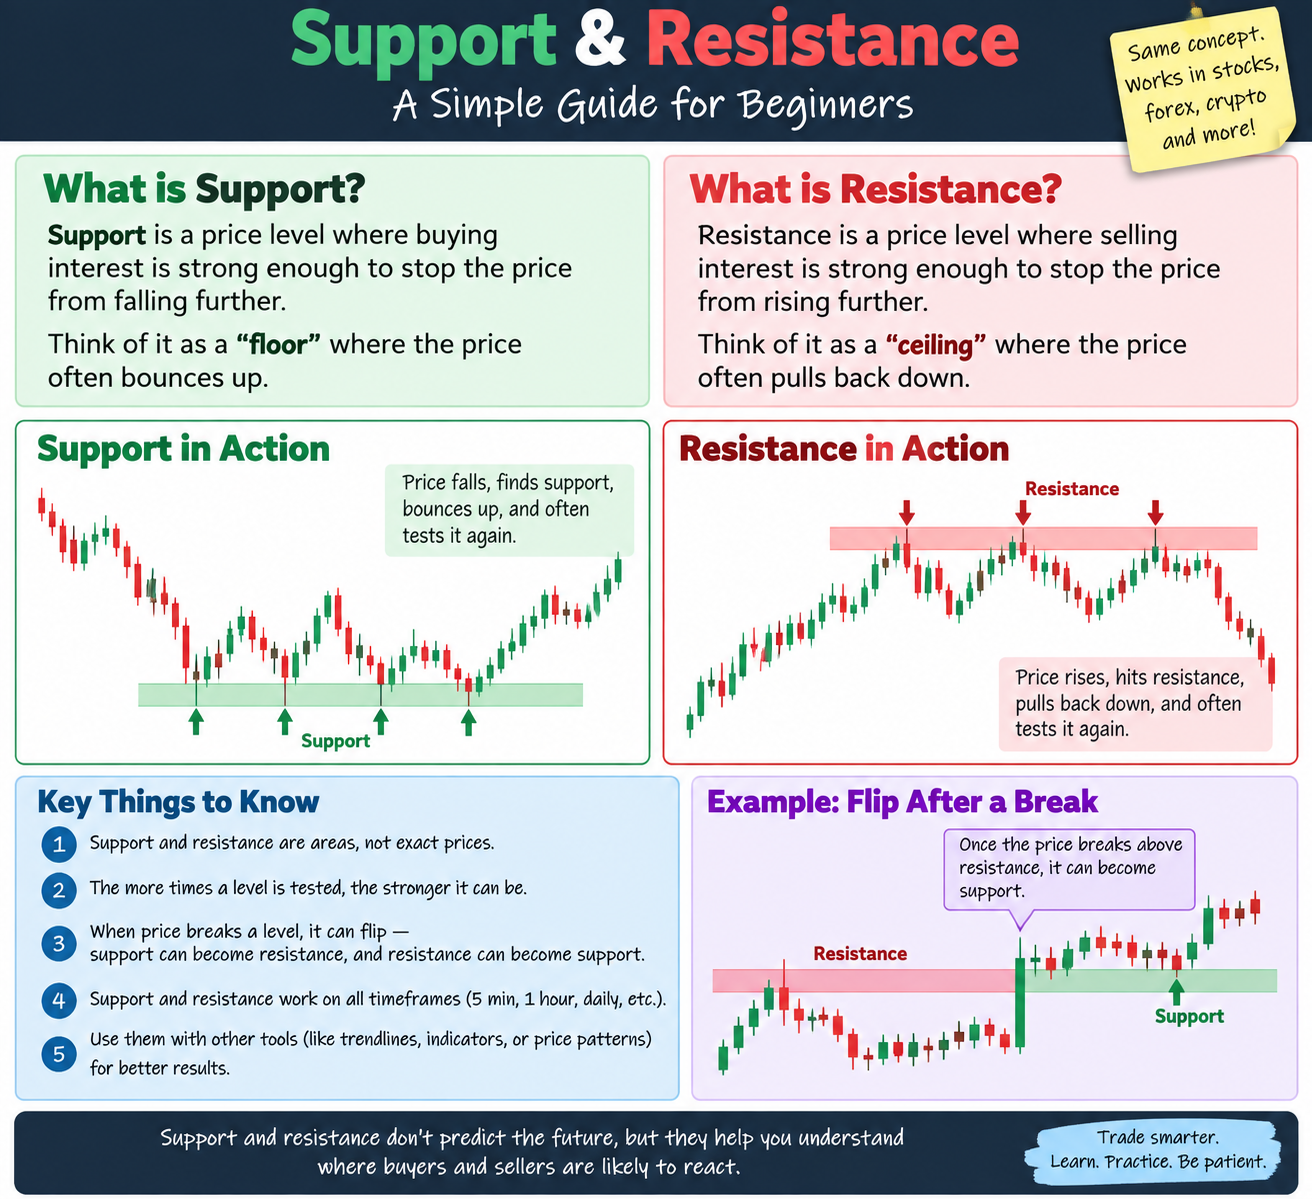
Support and resistance are important price areas on a trading chart where buyers or sellers have reacted in the past. Traders use these levels to help identify potential entries, exits, profit targets, stop areas, breakouts, and reversals.
The idea is simple:
Support is like a floor under price.
Resistance is like a ceiling above price.
But there is much more to understanding how support and resistance work.
In this beginner trading guide, we will explain what support and resistance are, how to find them on a chart, how traders use them, and some of the biggest mistakes new traders should avoid.
What Is Support in Trading?
Support is a price area where buying pressure may become strong enough to slow down or stop a price decline.
Think of support as a floor.
Imagine a stock is trading at $55 and begins falling.
When it reaches around $50, buyers begin entering the market.
Price moves higher.
A few days later, price drops toward $50 again and buyers step in again.
That $50 area may be considered a support level or support zone.
Traders may look at the chart and think:
“Buyers have previously shown interest around this price.”
That does not guarantee buyers will return.
However, it tells the trader that this is an important area to watch.
What Is Resistance in Trading?
Resistance is a price area where selling pressure may become strong enough to slow down or stop a price increase.
Think of resistance as a ceiling.
Imagine that same stock moves higher toward $60.
Every time price reaches around $60, sellers begin entering the market and the stock pulls back.
That area may become a resistance zone.
A trader looking at the chart might say:
“Price has struggled to move through this area before.”
That makes the resistance level worth watching when price returns.
Support vs. Resistance
The easiest way for a beginner trader to remember the difference is:
Support = Buyers may step in below price.
Resistance = Sellers may step in above price.
Support may help stop price from falling.
Resistance may help stop price from rising.
Neither level is guaranteed to hold.
Trading is about probabilities, not certainty.
Support and Resistance Are Zones, Not Exact Prices
One of the most important lessons when learning how to identify support and resistance is understanding that these areas are usually not exact prices.
New traders sometimes draw one thin horizontal line and believe price must react exactly at that number.
Markets rarely work that perfectly.
Instead, think of support and resistance as price zones.
For example, instead of saying:
“Support is exactly $50.00.”
You might identify support between:
$49.75 and $50.25
Price may briefly move below $50 and then recover.
That does not necessarily mean support failed.
It may simply mean the market was testing the larger support area.
Why Do Support and Resistance Levels Work?
Support and resistance exist because traders remember important price areas.
Market participants may remember where they previously:
Bought shares.
Sold shares.
Took profits.
Experienced losses.
Entered trades.
Exited trades.
Missed opportunities.
If price returns to those areas, traders may react again.
For example, someone who missed buying a stock at $50 may decide to buy if price returns there.
At the same time, someone who purchased at $60 and watched the stock fall may decide to sell when price returns to $60.
These decisions can create buying and selling pressure around previous price levels.
How to Find Support and Resistance on a Chart
Finding support and resistance becomes easier with practice.
The simplest method is to look left on the chart.
Ask yourself:
Where did price stop falling?
Where did price stop rising?
Where did price reverse?
Where did price bounce several times?
Where did a strong breakout begin?
Where did price consolidate?
These areas may become important support or resistance zones.
Step 1: Zoom Out
Before drawing levels, zoom out and look at the bigger picture.
You want to identify the obvious areas where price reacted strongly.
Step 2: Find Repeated Price Reactions
Look for areas where price has reacted more than once.
If price repeatedly reaches approximately the same level before reversing, that area may be important.
Step 3: Draw a Zone Instead of a Perfect Line
Do not worry about finding the exact penny.
Mark the general price area.
Step 4: Keep Your Chart Clean
Avoid drawing twenty support and resistance lines.
Too many levels can make your chart confusing.
Focus on the most obvious areas first.
The More Times Support or Resistance Is Tested
When price reacts to the same area multiple times, more traders may begin noticing it.
For example:
Price reaches support and bounces.
Later, price returns and bounces again.
Then price tests the same area a third time.
That level may become psychologically important.
However, beginners should understand something else.
Repeated tests can also weaken a level.
Every time price returns, buyers or sellers defending that area may become exhausted.
Eventually, price may break through.
Instead of thinking:
“This level held three times, so it has to hold again.”
Think:
“This is an important area. I need to watch how price reacts.”
What Happens When Support Breaks?
Support does not last forever.
If selling pressure becomes stronger than buying pressure, price may break below support.
When that happens, something important can occur:
Old support can become new resistance.
Imagine a stock repeatedly holds around $50.
Eventually, sellers push price below $50.
The stock falls to $47.
Later, price rallies back toward $50.
Instead of continuing higher, sellers appear near $50 and push price lower again.
The previous support level has now become resistance.
This is often called a support and resistance flip.
What Happens When Resistance Breaks?
The opposite can happen when price breaks above resistance.
Old resistance can become new support.
For example:
Price repeatedly struggles to move above $60.
Eventually, buyers push price through $60.
Price moves toward $64.
Later, the stock pulls back toward $60.
If buyers step in around that area, the previous resistance may now act as support.
This is another example of a support and resistance flip.
What Is a Support and Resistance Retest?
A retest occurs when price breaks through support or resistance and later returns to that area.
Many traders pay close attention to retests.
Imagine price breaks above resistance.
Instead of immediately entering the trade, a trader may wait to see whether price comes back down and tests the previous resistance level.
If buyers step in and the old resistance begins acting as support, the breakout may look stronger.
The same idea works in reverse.
If support breaks, price may return to the area and test it as resistance.
Retests can help traders better understand whether buyers or sellers are gaining control.
Support and Resistance on Different Timeframes
Support and resistance can work on almost any trading timeframe.
You can identify them on:
1-minute charts.
5-minute charts.
15-minute charts.
Hourly charts.
Daily charts.
Weekly charts.
Monthly charts.
Which timeframe matters most depends on your trading style.
Day Traders
Day traders may focus heavily on:
5-minute charts.
15-minute charts.
Hourly charts.
Previous day highs and lows.
Premarket highs and lows.
Swing Traders
Swing traders may focus more on:
Hourly charts.
4-hour charts.
Daily charts.
Long-Term Traders and Investors
Longer-term traders may pay more attention to:
Daily charts.
Weekly charts.
Monthly charts.
Higher-timeframe support and resistance levels can sometimes be more significant because more traders may be watching them.
How Traders Use Support and Resistance
Support and resistance trading can help traders plan several parts of a trade.
Potential Entry Areas
A trader may look for an entry near support if buyers begin showing strength.
Profit Targets
If entering near support, a trader may identify resistance as a possible area to take profits.
Risk Management
Support and resistance can help determine where a trade idea may no longer make sense.
Breakout Trading
A trader may watch for price to break through an important resistance area.
Breakdown Trading
A trader may watch for price to break below an important support zone.
The key is that support and resistance provide locations to pay attention to.
They should not automatically become buy or sell signals.
Do Not Trade Support and Resistance Blindly
One of the biggest beginner trading mistakes is buying simply because price reaches support.
Support does not guarantee price will bounce.
Resistance does not guarantee price will fall.
Instead, watch how price reacts when it reaches the area.
Near support, a trader might watch for:
Strong bullish candles.
Increasing buying volume.
Price rejecting lower prices.
A break of a short-term downtrend.
Higher lows forming.
Momentum beginning to change.
Near resistance, a trader may look for the opposite behavior.
The support or resistance level tells you where to watch.
Price action may help tell you what is happening.
Combine Support and Resistance With Other Trading Tools
Support and resistance can become more useful when combined with other forms of technical analysis.
These may include:
Moving averages.
Volume.
Trendlines.
Candlestick patterns.
Market structure.
Previous highs and lows.
RSI.
MACD.
VWAP.
Price patterns.
Using several pieces of information together is sometimes called confluence.
For example, imagine price reaches an important support zone.
That same area also lines up with a major moving average.
Volume begins increasing.
Buyers start producing strong bullish candles.
Several pieces of information are now pointing toward the same area.
That may be more meaningful than using support alone.
Common Support and Resistance Mistakes Beginners Make
Drawing Too Many Levels
If every price becomes support or resistance, your chart becomes difficult to read.
Focus on obvious areas.
Treating Levels as Exact Prices
Support and resistance usually work better as zones.
Assuming a Level Must Hold
No support or resistance level is guaranteed.
Ignoring the Larger Trend
Support may behave differently during a strong downtrend.
Resistance may behave differently during a powerful uptrend.
Chasing Breakouts
Price can briefly break resistance and then quickly reverse.
This is sometimes called a false breakout.
Ignoring Risk Management
Even a strong-looking setup can fail.
Always understand how much you are willing to risk before entering a trade.
A Simple Support and Resistance Strategy for Beginners
Here is a simple exercise for learning support and resistance.
Open a chart.
Zoom out.
Identify one major support area.
Identify one major resistance area.
Wait for price to approach one of those areas.
Watch how the candles and volume behave.
Do not immediately enter a trade.
Instead, practice reading the reaction.
Ask yourself:
Are buyers getting stronger?
Are sellers getting stronger?
Is price rejecting the level?
Is price breaking through the level?
Is price consolidating?
Is volume increasing?
Doing this repeatedly can help train your eyes to recognize price behavior.
Example of Support and Resistance
Imagine a stock is currently trading around $55.
You notice that price has bounced several times near $50.
You also notice that price has repeatedly struggled to move above $60.
Your chart might look like this:
Support Zone: $50
Current Price: $55
Resistance Zone: $60
Now you have two important areas to monitor.
If price falls toward $50, you watch how buyers react.
If price rises toward $60, you watch how sellers react.
You are not predicting what will happen.
You are preparing for several possibilities.
That is an important difference.
Support and Resistance FAQ
What is support in trading?
Support is a price area where buyers may enter the market and help slow or stop a price decline.
What is resistance in trading?
Resistance is a price area where sellers may enter the market and help slow or stop a price increase.
Can support become resistance?
Yes. When price breaks below support, the previous support area can sometimes become resistance.
Can resistance become support?
Yes. When price breaks above resistance, the previous resistance area can sometimes become support.
Are support and resistance exact prices?
Usually not. They are generally better viewed as zones or areas instead of exact numbers.
Does support and resistance work for day trading?
Yes. Support and resistance can be used by day traders, swing traders, and longer-term investors.
Does support and resistance work with stocks, options, crypto, and forex?
The concept of support and resistance can be applied to many liquid financial markets and chart types.
Is support and resistance enough to trade successfully?
Support and resistance can be useful tools, but traders should also consider price action, volume, market conditions, risk management, and their overall trading strategy.
Final Thoughts: Learning Support and Resistance
Understanding support and resistance for beginners is an important first step in learning technical analysis.
Remember the basic idea:
Support is an area where buyers may react.
Resistance is an area where sellers may react.
But never assume a level must hold.
Watch the price action.
Watch the volume.
Pay attention to the larger trend.
Look for confirmation.
Most importantly, protect your risk.
The goal of support and resistance is not to predict the future.
It is to help you identify areas where buyers and sellers may make important decisions.
Learning to recognize those areas can help you become a more patient, prepared, and disciplined trader.
LYKTrader Beginner Tip
Before entering any trade, ask yourself:
Where is the nearest support?
Where is the nearest resistance?
Where am I wrong if this trade moves against me?
How much am I willing to risk?
If you cannot answer those questions, your trade plan may not be complete yet.
Educational Disclaimer: LYKTrader content is provided for educational and informational purposes only. Nothing on this website should be considered financial, investment, or trading advice. Trading and investing involve risk, including the potential loss of capital. No trading strategy, indicator, support level, or resistance level guarantees a profitable outcome.